Linear Regression in Python
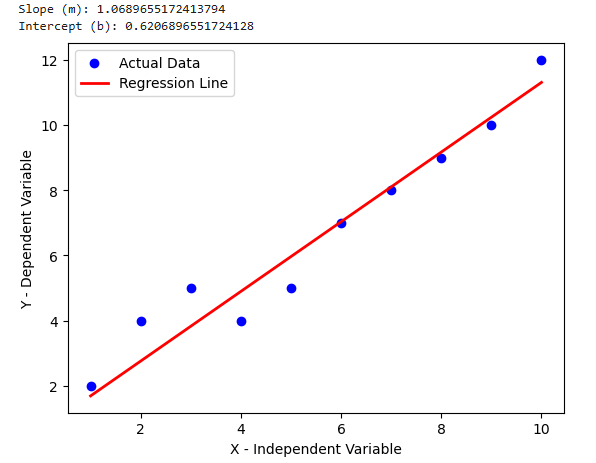
Description: Linear Regression is a fundamental supervised learning algorithm used for predicting continuous values. It establishes a relationship between an independent variable (X) and a dependent variable (Y) by fitting a straight line (also known as the regression line) to the data.
1. Simple Linear Regression
Simple Linear Regression is a fundamental Supervised Learning algorithm used to model the relationship between a single independent variable (X) and a dependent variable (Y). It assumes that the relationship between the two variables follows a straight line, defined by the equation:
Simple Linear Regression Equation:
Y = mX + b
- Y is the predicted value
- X is the input feature
- m is the slope (coefficient)
- b is the intercept
Here's a Python implementation of Linear Regression using both Simple Linear Regression and Multiple Linear Regression with scikit-learn:
Simple Linear Regression code snippet
    import numpy as np
    import matplotlib.pyplot as plt
    from sklearn.linear_model import LinearRegression
    from sklearn.model_selection import train_test_split

    # Sample dataset
    X = np.array([1, 2, 3, 4, 5, 6, 7, 8, 9, 10]).reshape(-1, 1)  # Independent variable
    y = np.array([2, 4, 5, 4, 5, 7, 8, 9, 10, 12])  # Dependent variable

    # Splitting dataset into training and testing sets
    X_train, X_test, y_train, y_test = train_test_split(X, y, test_size=0.2, random_state=42)

    # Create and train the model
    model = LinearRegression()
    model.fit(X_train, y_train)

    # Predictions
    y_pred = model.predict(X_test)

    # Model parameters
    print(f"Slope (m): {model.coef_[0]}")
    print(f"Intercept (b): {model.intercept_}")

    # Plot results
    plt.scatter(X, y, color="blue", label="Actual Data")
    plt.plot(X, model.predict(X), color="red", linewidth=2, label="Regression Line")
    plt.xlabel("X - Independent Variable")
    plt.ylabel("Y - Dependent Variable")
    plt.legend()
    plt.show()

2. Multiple Linear Regression
Multiple Linear Regression extends Simple Linear Regression by incorporating multiple independent variables (X1, X2, ..., Xn) to predict the dependent variable Y. The equation for Multiple Linear Regression is:
Multiple Linear Regression Equation:
Y = b0 + b1X1 + b2X2 + ... + bnXn
Where multiple independent variables X1, X2, ..., Xn contribute to predicting Y.
Multiple Linear Regression code snippet
    import pandas as pd
    from sklearn.linear_model import LinearRegression
    from sklearn.model_selection import train_test_split

    # Sample dataset with multiple features
    data = {
    "X1": [1, 2, 3, 4, 5, 6, 7, 8, 9, 10],
    "X2": [2, 3, 5, 7, 11, 13, 17, 19, 23, 29],
    "Y":  [3, 6, 7, 8, 10, 12, 15, 17, 18, 22]
    }

    df = pd.DataFrame(data)

    # Splitting into features (X) and target variable (y)
    X = df[["X1", "X2"]]
    y = df["Y"]

    # Splitting dataset into training and testing sets
    X_train, X_test, y_train, y_test = train_test_split(X, y, test_size=0.2, random_state=42)

    # Create and train the model
    model = LinearRegression()
    model.fit(X_train, y_train)

    # Predictions
    y_pred = model.predict(X_test)

    # Model parameters
    print(f"Coefficients (b1, b2): {model.coef_}")
    print(f"Intercept (b0): {model.intercept_}")

    # Display actual vs predicted values
    comparison_df = pd.DataFrame({"Actual": y_test, "Predicted": y_pred})
    print(comparison_df)
-----------------------------------------------------------------
    Output:
-----------------------------------------------------------------
    Coefficients (b1, b2): [1.21805737 0.29769665]
    Intercept (b0): 1.217840069534983

            Actual  	Predicted
    8      	18  	19.027379
    1       	 6   	4.547045
