Polynomial Regression
Polynomial Regression is a type of regression analysis where the relationship between the independent variable x and the dependent variable y is modeled as an nth degree polynomial. It allows us to fit a non-linear curve to the data, which is useful when the relationship between the variables is not linear.
📘 Description:
Polynomial regression fits a curve to the data using this general formula:
y = β0 + β1x + β2x2 + β3x3 + ⋯ + βnxn + ε
Where:
- y is the target variable (e.g., Salary)
- x is the feature (e.g., Level)
- βi are the coefficients
- n is the degree of the polynomial
📁 Dataset: polynomial.csv
Assume the CSV contains:
| Level | Salary |
|---|---|
| 1 | 45000 |
| 2 | 50000 |
| 3 | 60000 |
| 4 | 80000 |
| 5 | 110000 |
| 6 | 150000 |
| 7 | 200000 |
| 8 | 300000 |
| 9 | 500000 |
| 10 | 1000000 |
🧠 Why Use Polynomial Regression?
Linear regression would underfit this data (Salary doesn't grow linearly with Level). Polynomial regression can model the exponential-like increase more accurately.
🧪 Example: Polynomial Regression
import pandas as pd
import numpy as np
import matplotlib.pyplot as plt
from sklearn.linear_model import LinearRegression
from sklearn.preprocessing import PolynomialFeatures

# Load data
dataset = pd.read_csv('polynomial.csv')
X = dataset[['Level']]  # Feature
y = dataset['Salary']   # Target

# Create polynomial features (degree 4)
poly_features = PolynomialFeatures(degree=4)
X_poly = poly_features.fit_transform(X)

# Train polynomial regression model
model = LinearRegression()
model.fit(X_poly, y)

# Use DataFrame instead of raw NumPy array
level_df =  pd.DataFrame({'Level': [6.5]})
level_poly = poly_features.transform(level_df)
predicted_salary = model.predict(level_poly)

print(f"Predicted salary for level 6.5: ${predicted_salary[0]:,.2f}")

# Plot
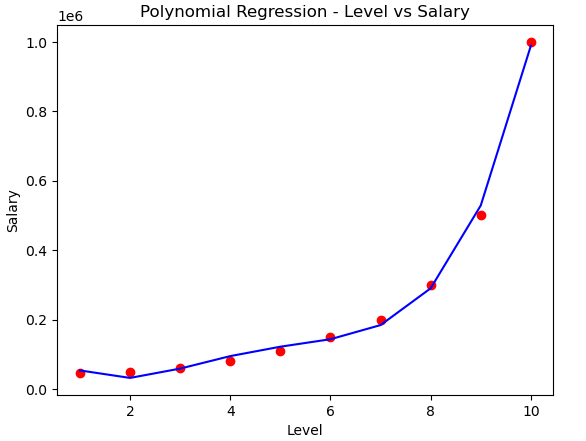
plt.scatter(X, y, color='red')
plt.plot(X, model.predict(X_poly), color='blue')
plt.title("Polynomial Regression - Level vs Salary")
plt.xlabel("Level")
plt.ylabel("Salary")
plt.show()

Output:
A smooth curve fitting the dataset points much better than a straight line.
Predicted salary for level 6.5: $158,862.45
